Article Text

Abstract
Care home residents are 3 times more likely to fall than their community dwelling peers and 10 times more likely to sustain a significant injury as a result. 2 A project commenced at a care home in Aberdeen with the aim of reducing the number of falls by 20% by 30st April 2016 using the model for improvement. Qualitative data was gathered to establish staff belief about falls and their level of knowledge& understanding about falls risks and how to manage these. This informed the training which was delivered and iterative testing commenced with the introduction of the Lanarkshire Falls Risk/Intervention tool – where the multifactorial nature of a resident's falls risks are explored and specific actions to manage these are identified and implemented. Failure to meet PDSA predictions about sharing risk reducing actions with staff and length of time to complete the tool prompted a focus on communication and the processes whereby the tool is completed. “Teach back” was employed to highlight communication difficulties and ultimately the introduction of Huddles out improved the flow of information about residents and informed the Falls Risk/Intervention tool. 5 PDSAs were completed and within them multiple tests of change. The improvement shift came following a root cause analysis of the nature & cause of one resident's falls and applying the tool & communication processes. The average falls rate fell from 49 per 1000 occupied bed days to 23.6 and was sustained because of the attention to the importance of communication. The aim was achieved with a 36.6% reduction in Falls rate.
Care home residents are 3 times more likely to fall than their community dwelling peers and 10 times more likely to sustain a significant injury as a result. 2 A project commenced at a care home in Aberdeen with the aim of reducing the number of falls by 20% by 30th April 2016 using the model for improvement. Qualitative data was gathered to establish staff belief about falls and their level of knowledge& understanding about falls risks and how to manage these. This informed the training which was delivered and iterative testing commenced with the introduction of the Lanarkshire Falls Risk/Intervention tool - where the multifactorial nature of a resident's falls risks are explored and specific actions to manage these are identified and implemented. Failure to meet PDSA predictions about sharing risk reducing actions with staff and length of time to complete the tool prompted a focus on communication and the processes whereby the tool is completed. “Teach back” was employed to highlight communication difficulties and the introduction of Huddles improved the flow of information. 5 PDSAs were completed and within them multiple tests of change. The improvement shift came following a root cause analysis of the nature & cause of one resident's falls and applying the tool & communication processes. The average falls rate fell from 49 per 1000 occupied bed days to 23.6 and was sustained because of the attention to the importance of communication. The aim was achieved with a 36.6% reduction in Falls rate.
This is an open-access article distributed under the terms of the Creative Commons Attribution Non-commercial License, which permits use, distribution, and reproduction in any medium, provided the original work is properly cited, the use is non commercial and is otherwise in compliance with the license. See:
Statistics from Altmetric.com
Problem
One in three people over the age of 65 and one in two over the age of 85 fall every year.1 These odds are shortened for care home residents who are three times more likely to fall than their community dwelling peers and 10 times more likely to sustain a significant injury as a result2 40% of care home admissions are falls related and unfortunately there is a culture and belief that falls are inevitable and maintaining safety can result in mobility being restricted.
The care home population is rising and in Grampian alone it is estimated to rise by 23.3% by 2018.3 Care home residents accounted for 28.83% of all people (aged 65 or over) admitted to Aberdeen Royal Infirmary's Emergency Department with a fall between Aug 2014-July 2015; and notwithstanding the growing impact on unscheduled care, falls also lead to pain, fear, loss of independence, a poorer quality of life and can ultimately contribute to death.
In 2011 the Care Inspectorate/NHS Scotland published a good practice resource: “Managing falls & fractures in care homes for older people”4 This contained information and tools including a multifactorial falls risk screen, however audit in 2013 identified that only 30% of the Care Homes who responded had completed the resource's4 self-assessment which implied a low uptake of the resource.
Background
Nice guideline 1615 recognises that the causes of falls are multifactorial and many factors can contribute to heighten the risk, such as physical frailty, the presence of long term conditions, physical inactivity, taking multiple medications and the unfamiliarity of new surroundings – all common to care home residents. It also recognises the benefit of multifactorial assessment & intervention in a person-centred approach to reducing the risk of falls & falls with harm. A review of evidence is also more supportive of a multifactorial multidisciplinary approach than solo interventions and I suggest that the limitations of using predictive falls risk assessments in hospital settings is equally applicable to the care home setting. In either area a prediction of “high” or “low” risk may under or overestimate the risk whilst providing false reassurance that ‘something is being done’7 ,8 ,9 This supports the hypothesis that the falls rate can be reduced by exploring the multifactorial risks and generating an intervention plan to manage the risks
Response to the low adoption rate of the Care Inspectorate/NHS Scotland good practice resource – Managing falls & fractures in care homes for older people 20124 and results from their subsequent audit (2013) which highlighted good outcomes where the resource was used with the support of local teams, led to the birth of the “Up and About in Care Homes” project (an 18 month Scottish Government funded improvement project from 2014 to 2015). The project supported 38 care homes in Scotland to use the good practise resource. Together with improvement methods and tools the project succeeded in developing and testing innovative ways of working to improve care. Participating care homes found that taking a proactive team approach to improvement and using the resource reduced their residents' falls and injuries due to falls. The resource included a multifactorial falls risk screen & action plan.
Baseline measurement
In order to develop a clearer understanding of the falls situation with in the care home I collected data from multiple sources. This included a review of the Care Home's Self-Assessment in relation to falls from the Care Inspectorate good practise resource4 which identified a belief that a multifactorial falls risk screen was being used when in fact a study of the Residents' care plans identified that 3 of 29 residents had a predictive falls risk screen using FRASE (Falls Risk Assessment in the Elderly) and no residents had a multifactorial fall risk screen. Falls data from the previous 3 months was plotted onto monthly safety crosses then the number of weekly falls was inputted alongside the bed occupancy into a statistical process chart which established a baseline mean falls rate of 49 falls per 1000 occupied bed days. The three months of falls data was also plotted on a measles chart (a map of the home where a dot is placed on the location of the fall) which did not identify any pattern or trend for the locations of the falls. They were also plotted on a 24 hour clock to explore whether there were key times in the day when the falls occurred. This identified that 75% of all falls occurred between 1200 & 2130 however the highest concentration of falls was within this period between 1230 & 1600 and accounted for 41% of the total number of falls. We also established that falls occurred more frequently on Saturdays and Mondays. Finally plotting the frequency of individual residents' falls identified 3 residents who fell most frequently. Data also told us that on 02/11/15 (start of the project) it was 9 days since an injurious fall had been reported.
Design
Initially staff belief about the causes & consequences of falls was explored using the root cause analysis tool – fish bone – which identified an awareness of some intrinsic and extrinsic falls risk factors. Brainstorming posters were also used to gather staff ideas on how falls could be prevented. Both influenced the design of the falls training sessions.
When considering the prevention of falls, evidence supports4 ,5 ,8 the need for an awareness of the multifactorial nature of an individual's falls risks and a subsequent requirement to identify and implement interventions which will reduce them. As such the “Lanarkshire Care Home Residents' Falls Risk/Intervention tool” (Tool) was adopted after consultation with the Up & About in Care Homes project lead. This tool prompts staff to consider 11 key risk factor areas, offers solutions to consider and an opportunity to generate and action plan. Criteria for triggering the completion of the tool was agreed – new resident, post fall, medication change or discharge from hospital – by the improvement group in the care home. However immediately responding to all those triggers would not have allowed for the initial small scale tests required to test the tool so it was agreed that we would initially only use the trigger – new resident. Training was delivered to familiarise staff with the key risk factor areas & considerations thus enabling them to use the tool.
The Care Home manager felt that as the care assistants in the improvement group have first-hand knowledge of their residents they would be the best placed to test the tool. It was agreed that the tool would be considered completed when the identified risk reducing actions were handed over from the staff member completing the tool to nursing and care assistant colleagues. Completing the tool was a task which sat beyond their ordinary scope of practice so a registered nurse was identified to support them and a process measure of time from trigger to completion would be recorded. It became clear that this created two additional processes which would always pose a risk to sustainability.
We also explored the processes involved in the handover of information from nursing to care staff. A process map was drawn and morning handover was observed on 3 occasions.
Three months into the project the tool was being completed by a registered nurse within existing admission & care planning processes. Within 4 months communication processes to draw on the Care Assistants' knowledge of their residents as well as ensuring understanding and implementation of actions had been created, thus ensuring sustainability.
Strategy
The Model for Improvement was used as we were aiming to accelerate an improvement with a focus on change within existing processes. The Plan Do Study Act (PDSA) cycles enabled staff involvement in agreeing, testing and reflecting on the changes and a driver diagram [supplementary file – driver diagram] was created to focus thinking on how to achieve the aim of reducing the number of falls by 20%. The improvement group consisted of the care home manager, a senior care assistant & three care assistants (who were known as the Falls Champions) and the HSCP Falls Lead.
Five PDSA cycles were completed and within them multiple tests of change over a 6-month period. Throughout the project the number of falls and bed occupancy was measured weekly and the time from trigger to completion of the tool and completion rate was recorded as each tool was completed.
PDSA 1 [19/10/15 – 12/11/15] hypothesis: “Will gathering and displaying baseline data demonstrate to the wider team a need to improve and inform the content & design of a falls training session?” PDSA 1.0 proposed creating a falls information board to display baseline data in the form of a monthly falls safety cross and a run chart of the last 11 months recorded falls. Staff were asked to rate the following statements: “Falls are an inevitable part of aging” “Falls can be prevented” “It is useful to have the falls data displayed” between strongly disagree & strongly agree on a visual analogue scale. 59% of the staff participated. With regard to the statement ‘falls can be prevented’ 16/19 indicated between “agree & strongly agree”. In contrast 19/19 strongly agreed that falls are an inevitable part of aging. This informed the content of the training and led to PDSA 1.1 – exploring and expanding on the belief that some falls can be prevented. Two idea gathering posters were put on the falls information board with the questions: “What causes falls?” “What can you do to prevent falls?” Twenty-eight ideas were gathered which exceeded the predicted twenty and demonstrated both knowledge and gaps in knowledge, informing the content of the training delivered in PDSA 1.2 Here 10 out of 31 members of staff attended including the four “falls champion” care assistants from the improvement group. The tool was introduced at the training session as an exercise for implementing learning and staff feedback was that it appeared easy to use. This led to testing of the tool with one new resident in PDSA 2.
PDSA 2 [17/11/15- 13/01/16] hypothesis: “Can staff demonstrate a knowledge & understanding of falls risk identification and use the Lanarkshire Falls Risk/Intervention tool?” The Falls Champions in PDSA 2.0 tested the tool as a group with one new resident. This prompted a need for additional information & activity out with the information sources & processes being used and as such were unable to complete it. Modifications were made to the tool & processes, and a registered nurse was identified to support them with the tests leading to PDSA 2.1. Here one of the Falls Champions tested it with another new resident and while completing the paperwork within the predicted time and to a high standard failed to hand the identified actions to over to the wider team. PDSA 2.2 aimed to test a process where the Falls Champion could share the actions identified in the tool at morning handover and a second Falls Champion proceeded to use the tool with a third Resident. On this occasion, they had difficulties completing the paperwork and despite the process proposed to assist with the handover this did not happen. At this point the completion rate remained at 0% and in studying each of the PDSAs it was clear that time and shift allocation made it difficult for the Falls Champions to draw on the nursing support identified for both completing the paperwork and sharing the actions. On reflection staff hierarchy and the fact that completing the tool was a task out with their normal scope of practice and sat over and above their normal tasks made it highly unlikely that the process could become sustainable. This prompted a bid to have a registered nurse join the improvement group and subsequently PDSA 2.3 saw her test the tool within the nursing admission process which met the prediction of completing the tool & handing over actions. In addition, it gleaned feedback that the tool improved the breadth of information gathered within the admission process. This was repeated equally successfully with another new resident and PDSA 2.4 saw it tested within the care planning processes – again with good results matching predictions. The completion rate rose from 0% to 17%. Studying PDSAs 2.3 & 2.4 with some curiosity flagged the question – how do we know if the action plan handed over to staff is fully understood?
PDSA 3 [06/02/16 – 10/02/16] hypothesis: “How do we know if the action plan handed over to staff is fully understood?” introduced the use of “teach back”. In PDSA 3 the Nurse asked a senior care assistant to teach back the actions she shared. All four actions were described back (beyond the two predicted) and both described it as a “very positive” experience. PDSA 3.1 saw it repeated with a different senior care assistant with equal success hence PDSA 3.2 where the senior care assistant from PDSA 3.1 and the Nurse repeated the test with two different care assistants. This highlighted gaps in understanding and while both were adept at providing reassurance of understanding neither could describe back the instructions as was requested in the “teach back”. This led to agreement that PDSA 3.3 should aim to test 1:1 handover supplemented with demonstration or photographs as appropriate to the actions to ensure clarity and compliance with implementation. This was well received by staff who reported that it was a useful process and teach back continued to be used.
We were three months into the project, had made good progress with the use of the tool and the communication of actions but there was no change to our falls rate (OM). When exploring staff belief, many staff felt that it was one resident who fell the most and because of her complex problems nothing could be done about this – interestingly she was one of three residents who fell equally frequently. So PDSA 4 [10/02/16 – 11/3/16] proceeded to use the root cause analysis tool ‘5 whys’ to address the hypothesis: “can a deep dive into one resident's falls impact on the falls rate?” and explored the nature of her falls using the ‘falls risk/intervention tool and two key actions were identified. Her family were involved in the root cause analysis exercise. Earlier iterations ensured that we had process reliability around the communication of and consistent implementation the actions, which resulted in a significant reduction in her falls (on completion of the project it was 75 days since her last fall in comparison to the monthly average of 2.5 falls over the previous 6-months). This was particularly powerful in challenging staff belief and importantly bringing staff on board.
PDSA 5 [24/03/16 – 29/04/16] and the final hypothesis asked: “Can processes be put in place which improve the breadth & depth of information gathered for the Falls Risk/Intervention tool and increase involvement of Residents, Family, Friends, Care Assistants & Activity Co-ordinator?” Learning from staff involvement in the root cause analysis and the training sessions highlighted the wealth of knowledge & ideas they have about their residents; however existing communication processes made it difficult to fully tap into this. We had also recognised that the action plan generated by the falls risk/Intervention tool would only ever be as good as the information that goes into it and if the actions weren't handed over & implemented consistently the tool was simply a paper exercise. So, for the final iteration we tested using “huddles” where staff gathered for a 5 – 15 minute period away from the rush of morning handover to share new information about their residents. With hierarchy flattened staff spoke positively about the experience which was reflected in the impact ‘Wordle’ [CHART 4]. In PDSA 5.0 four members of staff attended and each shared a “new” observation or piece of information about a resident which was new to two staff at the huddle. PDSA 5.1 tested the huddle on night shift where building layout and staff allocation made night shift a solitary experience – four staff were involved and on this occasion, all learned new information. An unintended consequence was that moving and handling issues were discussed & resolved and information from permanent night staff was passed to day shift. Beyond PDSA 5.1 we did not achieve the aim of daily huddles but they occurred at least weekly on day shift and more frequently on night shift. Two senior care assistants & two nurses took responsibility for initiating huddles.
Results
Outcome measure: Falls in the care home were recorded on a safety cross then plotted weekly as a rate per 1000 occupied bed days (OBD) on a statistical process chart (U chart). This identified a downward shift in the falls rate from a mean of 49 per 1000 OBD to 23 demonstrating a sustained improvement of 36.3% [CHART 1]
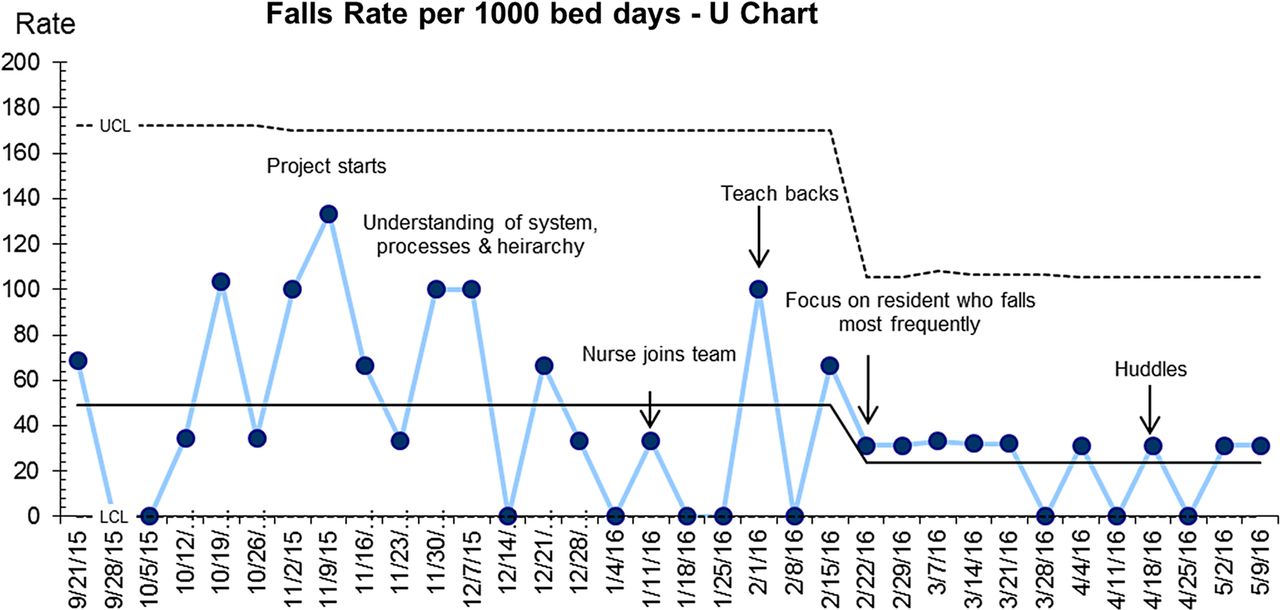
Outcome measure: Falls in the care home were recorded on a safety cross then plotted weekly as a rate per 1000 occupied bed days (OBD) on a statistical process chart (U chart).
Process measures (PM):
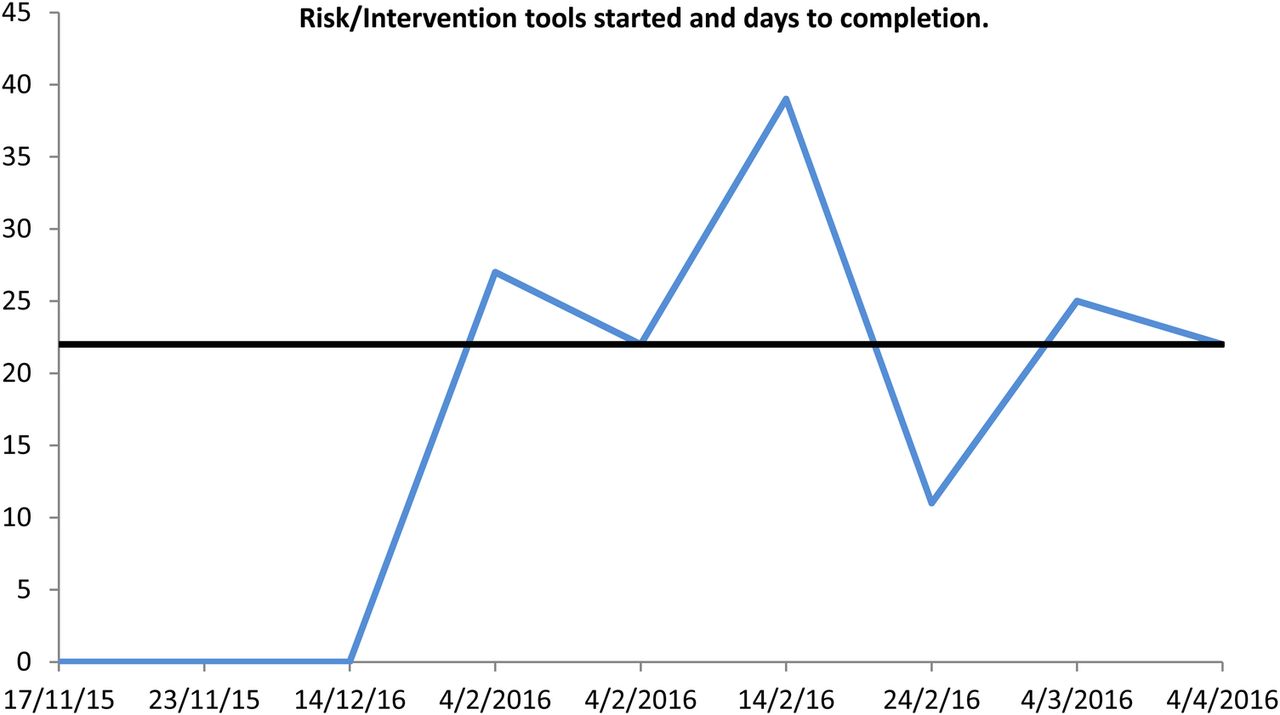
There were 3 tools started but not completed and 6 tools fully completed with a median completion time of 22 days PM1: Time from triggering the ‘falls risk/intervention tool’ to completion (handover of actions) identified difficulties in achieving process reliability while the care assistants were completing the tool. This prompted the invite of a nurse into the improvement group and subsequent tool testing within the admission & care planning processes [CHART 2]

Process measure 1: Time from triggering the ‘falls risk/intervention tool’ to completion (handover of actions)
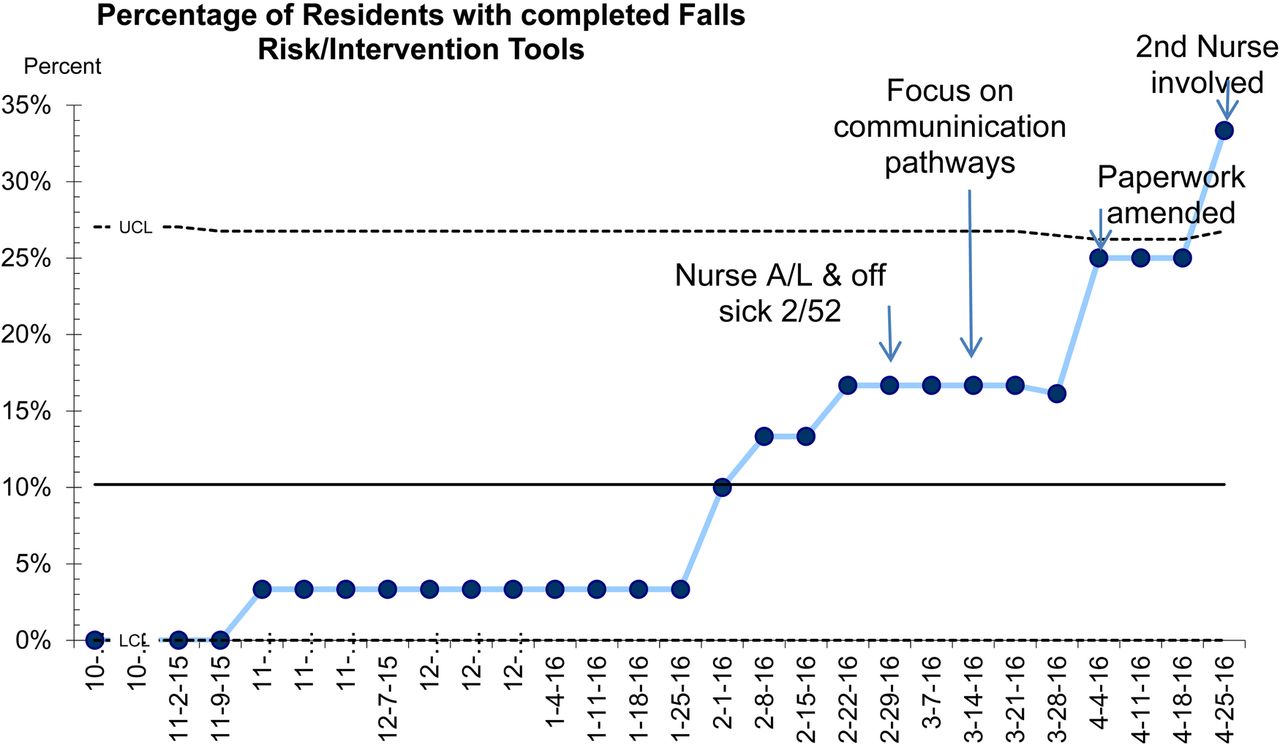
PM2: 33.33% residents had completed Risk/Intervention tools [CHART 3]

Process Measure 2: % residents had completed Risk/Intervention tools
Balancing measure:
Qualitative data was gathered to explore the impact the project had had on staff. The responses were compiled into a Wordle and the most frequently reported words included: Falls, Communication, Information & Huddles [CHART 4]

Balancing measure: Impact of project on staff
Lessons and limitations
I learned a number of lessons from this project. Firstly, the importance of appreciating and respecting the system you are working in and while there are similarities between care homes, hospitals and the home environment with regard to falls prevention, systems are very different with unique advantages & challenges. Shadowing and observation is time well spent when getting to understand a system and importantly learning about the processes within. It also helped identify where assumptions about process reliability were made.
With regard to bias and confounding staff belief and hierarchy played a role in failing to meet the prediction measure in PDSA 2 – completing the tool and handing over the actions. Here where Care Assistants within the improvement team had identified actions to manage risks using the tool they experienced resistance from some members of staff to implementing them principally because of hierarchy and some belief that falls could not be prevented.
The discipline of documenting PDSAs and clarity of operational definitions were key when quickly identifying when tests weren't working. Along with appropriate data they all helped challenge a drive to push on regardless and added weight & content to the preparation for a bid to bring a registered nurse into the improvement team. The improvement with a resident at the heart of the story was powerful in challenging staff belief and bringing people on board and without a doubt enthusiasm is infectious. I learned that communication and creating opportunities for communication can be pivotal to the success of a project and that “teach back” is a useful tool.
It was difficult working as a guest in an organisation out with the NHS but regular group meetings, preparation for the meetings, individual mentoring, capturing & using staff ideas, agreement with team members about their preferred form of communication out with my visits and finally praise & encouragement; all helped build a trusting and productive relationship.
Due to the improvement made as part of this project staffing hours were saved by not having to complete as many post fall incident forms, close monitor as many of residents who had fallen, contact as many worried relatives and investigate the falls. The inclusion of the falls risk/intervention tool in the admission and care planning processes should ensure sustainability as should the popularity huddles hold with staff. Project limitations included the amount of time I could spend at the care home within and out with my substantive post, not being on site and availability of staff. While we achieved the aim process reliability was not achieved with using the risk/intervention tool with the all post fall reviews. Time did not allow further tests with family involvement nor did we achieve the aim of daily huddles however these can be addressed with ongoing improvement support. We are in early discussion at the Aberdeen NHS & Care Home Liaison group about establishing a QI & Learning collaborative for local care homes.
Conclusion
The falls rate was reduced by 36.3% with the introduction of a falls risk/intervention tool and by creating communication opportunities which widened and deepened the information gathering which informed the risk identification and ensured that actions to manage these were widely shared, understood and consistently applied. The improvement was demonstrated as a shift in the data points on a SPC-U chart and thus the aim of reducing the number of falls by 20% was surpassed. The process measures clearly identified when progress wasn't being made thus prompting an addition to the improvement group membership and change to which processes and by whom the tool was being tested.
The results are sustainable as the tool was embedded in the care planning and admission processes. The project adds to the evidence base around applying a multifactorial multidisciplinary approach by specifying the need to consider how information is gathered and actions handed over. The use of the falls risk/intervention tool and associated consideration of communication processes has spread to two further care homes. Learning from teach back has been shared with community AHPs and has influenced how information, advice and instructions are shared with care home staff.
Acknowledgments
The Scottish Quality & Safety Fellowship Programme
Alison Hunter
Vicki Tully
Lianne McInally
Lynn Flannigan
Nadine Garcia
Edith MacIntosh
Footnotes
Declaration of interests Nothing to declare
Ethical approval According to NHS Grampian Clinical Effectiveness guidance this work met the criteria for operational improvement activities and is therefore exempt from ethics review.