Article Text

Abstract
Background The direct admission process is a complex system that can be aggravated by inherent gaps in communication leading to inefficient continuity of care and patient safety issues. Bypassing the emergency room, triage is often associated with long periods of unmonitored observation and significant delays in patient assessment. We identified significant communication gaps, delays in placement of admission orders and patient assessment during the direct admission process at our institution. To address this issue, we created and implemented a standardised direct admission flow diagram that consists of a step-by- step direct admission process, which includes a communication device and a triage power plan in the Electronic Medical Record.
Methods We used the Plan-Do-Study-Act (PDSA) model for Quality improvement to address communication gaps in the direct admission process Baseline measurement confirmed two critical gaps in communication: 1) communication to the Medical Admitting Resident (MAR), the central source of communication of all medicine admissions, and 2) delays in placement of orders and assessment of the patient.
Results Two months after implementation of a standardised process that addressed the two major gaps in communication, we found that communication to the MAR increased from 16% (7/42) to 100% (15/15). Additionally, the average time for order placement and assessment of patient decreased from 153 minutes to 53 minutes (n=15).
Conclusion In order to improve the safety of direct admissions, the entire process must be carefully analysed and potential delays in patient assessment should be minimised. A standardised flow diagram that identified and targeted specific communication gaps can minimise delays in patient care.
- patient safety
- quality improvement
- healthcare quality improvement
- PDSA
This is an Open Access article distributed in accordance with the Creative Commons Attribution Non Commercial (CC BY-NC 4.0) license, which permits others to distribute, remix, adapt, build upon this work non-commercially, and license their derivative works on different terms, provided the original work is properly cited and the use is non-commercial. See: http://creativecommons.org/licenses/by-nc/4.0/
Statistics from Altmetric.com
Problem ’SMART aim'
Stony Brook University Hospital is an academic medical centre and serves as the tertiary care centre of Suffolk County, New York. The internal medicine residency programme consists of approximately 96 trainees from postgraduate year 1–3. A direct admission is defined as a non-emergent admission directly to the hospital floor; the patient bypasses the emergency room (ER) and arrives directly to the general medicine ward. Directly admitted patients are from an outside hospital when there is a general medicine floor-to-floor transfer. These patients are typically transferred to our hospital for resources that are available in a tertiary care setting, that is, procedures or specialist that cannot be provided at another facility. Patients can also be admitted directly to a general medical floor from a hospital-affiliated outpatient clinic if a physician determines the patient requires inpatient care. At our institution, the medical admitting resident (MAR) is the central point of communication for all medicine admissions to the hospital. The issue with direct admissions came to our attention through resident concerns, internal observation of delays in patient assessment and incident reports related to the direct admission process. A resident quality improvement (QI) team to analyse the issue of the improper direct admission process carried out a step-by-step, in-depth flow diagram (from decision to accept the patient to our facility to the physical arrival of the patient to the ward). Based on the flow diagram, we identified a variable process without a structured step-by-step protocol. We realised that the overall process was confusing and ill defined, leaving the trajectory of care up to the discretion of the accepting clinician, as there was no formalised method. Furthermore, we identified two major gaps in communication during the direct admission process: (1) communication to the MAR, the central source of communication of all medicine admissions, and (2) delays in placement of orders and assessment of patient.
The objectives of our QI project were to improve communication to the MAR and to decrease time delays in placement of orders and patient assessment. This was achieved through the use of a standardised direct admission flow diagram that consists of a chronological direct admission process in the department of medicine. We aimed to increase the number of direct admissions that the MAR was aware of by 20% and decrease the time to order entry and patient assessment by 20% over a 6-month period.
Background
Hospitals are under increasing pressure to improve the efficiency of healthcare delivery, especially in light of national healthcare reform.1 2 Improving the throughput of patients in the emergency department (ED) includes the development of direct admission systems in which patients needing admission, but not emergent care, can bypass the ED altogether.3 Although the direct admission process can improve patient flow, the process may not always be the safest option, especially when associated with significant delays in patient assessment and order entry. The joint commission has identified the need for more effective methods in the transitions of care between healthcare organisations, with ‘communication breakdown between providers’ as one of the root cause of ineffective transitions of care.4
Our institution recognised the opportunity to improve communication and time delays in patient care during the direct admission process. We noted a paucity of the literature describing the development and use of a process to improve the direct admission process. To our knowledge, there is no standardised consensus on how to conduct effective direct admissions. Several studies have shown that a well-structured system such as algorithmic approaches and step-by-step flow diagrams can improve the direct admission process, but the tools used are often specific to the type of institution. Our aim was to design a standardised process that is applicable to our institution and target specific communication points in the direct admission process. The overall goal was to improve communication to the MAR and decrease time delays in order entry and patient assessment.
The direct admission process can be complex, and all complex systems can be aggravated by inherent gaps, or discontinuities of care, that result in patient safety problems.3 One study found that increased boarding time in the ED due to lack of available beds may lead to increased patient morbidity from factors such as missing doses of key medications while waiting.3 Bypassing the ER via direct admissions can be a potential area to decrease these gaps in care. However, directly admitted patients who bypassed initial triage in the ER, resulted in long periods of unmonitored observation and significant delays in patient assessment at our institution. This posed significant risks to our patients. Our goal was to ultimately use a structured process to increase MAR communication and decrease time delays during the direct admission process.
Methods
Baseline measurement
Prior to starting this project, we reviewed our incident reports submitted by our residents that were specifically related to direct admissions. Data from the patient incident reporting system from 2014 showed that 3/5 (60%) of resident incident reports involved the direct admission process. At our institution, there is a lack of incident reports conducted by trainees, therefore the sample size is small and limited a more thorough evaluation of the baseline data. Analysis of the error reports related to direct admissions demonstrated communication breakdown as the main root cause of the events. A resident QI group volunteered to investigate the scope and address the communication issues related to the direct admission problem. The first aspect of the baseline measurement was to develop an understanding of the process involved in the direct admission of patients. This was done by using a flow diagram, a diagrammatic scheme that depicts the direct admission process from decision to accept the patient to the physical arrival of the patient. To create this flow diagram, the resident QI group interviewed and gathered data from stakeholders in the admission process: transfer call centre staff, hospitalists, chief nursing officers and patient safety officers from the institution. The resident team produced a flow diagram depicting the multiple ill-defined steps as well as two critical points of communication (points A and B) in the direct admission process (figure 1). In light of the collected data, we determined that the current direct admission process was ill defined, error prone and lacked streamlined communication. We realised that the creation of a standardised and structured process that addresses communication between clinicians was necessary at our institution. After a thorough literature search, the intervention agreed on was the use of a formal flow diagram that addressed communication issues related to the direct admission process .
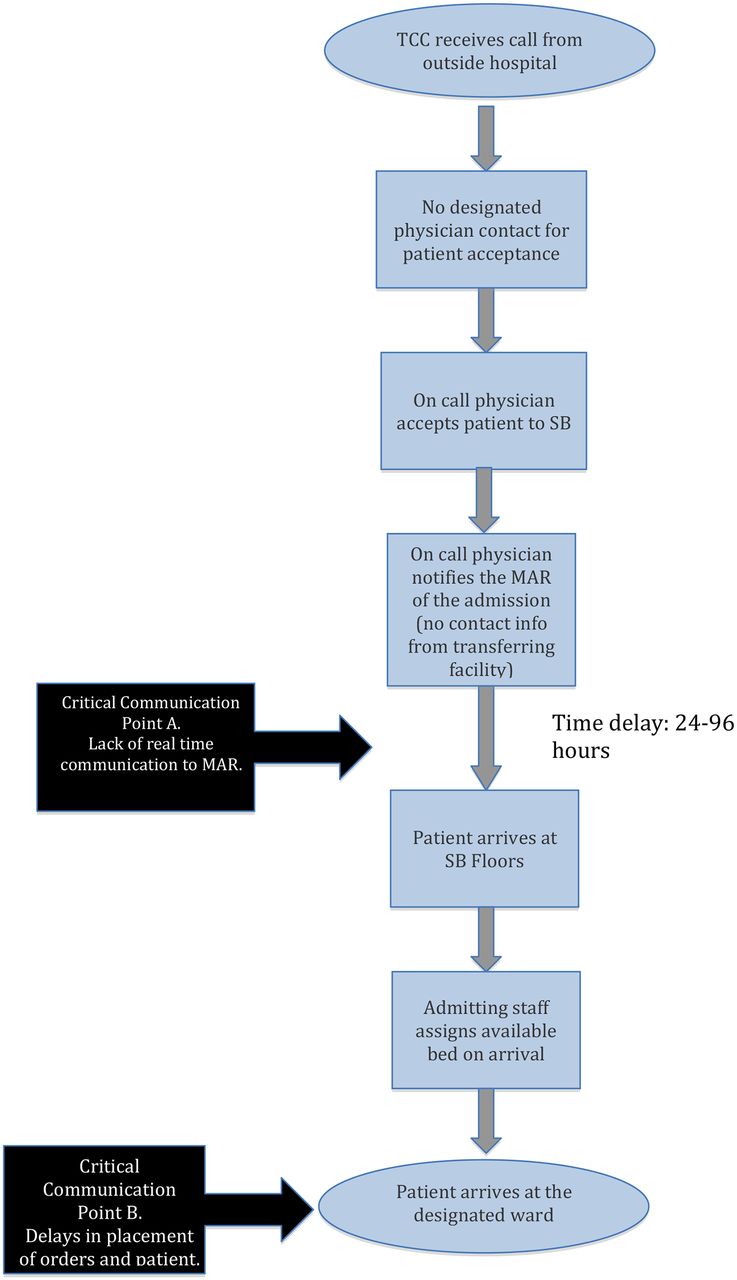
Flow diagram prior to intervention.
The second aspect of baseline measurement was to further understand the identified critical points in communication A (communication to the MAR) and B (delays in orders and patient assessment) depicted in the flow diagram. We conducted retrospective analyses of 42 medicine direct admissions over a period of 6 months on the general medicine service. We reviewed our MAR daily admissions tracking log for all direct admissions documented by the MAR. This is an excel spreadsheet that contains all medicine admissions with date, time and point of contact for all admissions. We assumed that there was no communication of the direct admission if it was not documented on the MAR tracking log. We found that only 7 out of 42 patients (16%) were documented in the MAR tracking log. This presumably meant that 35 out of 42 (83%) patients were directly transported to the floor with no communication to a physician. This is critical since the MAR is the central source of all incoming medicine patients; they are responsible for notifying the admitting residents of all admissions to Stony Brook. We further supplemented our baseline data by looking at critical point in communication B (delays in placement of orders and patient assessment) on the flow diagram. To further understand critical communication point B, we reviewed our original pool of 42 direct admissions over the same 6-month period. Of the 42 direct admissions, 23 of them had documented arrival times by emergency medical service (EMS) transport. We then measured time (in minutes) from documented EMS arrival of the patient to time of order placement (of vitals, labs or medication) by a physician or mid-level provider. In addition, we looked at the rates of unmonitored events, which we defined as abnormal lab findings, vital signs or rapid responses during the interval period. Abnormal lab findings or vital signs were defined as any deviation from the normal values that were not acted on or addressed during the interval time period. Based on chart review of orders, we found an average time delay in order placement of 153 min and 65% (15/23) of unmonitored events. Fifteen out of 23 (65%) patients was subsequently noted to have abnormal lab findings during time lag intervals. Some examples of abnormal lab findings include: blood sugar greater than 300 mg/dL, troponin elevation (troponin T<0.05 ng/mL) and hyperkalaemia (potassium level >5.5 mmo/L).
Based on the above baseline data, we determined that a standardised protocol will address the need for a step-by-step flow with specific attention to find a solution for critical communication points A and B (poor MAR communication and delays in admission order placement and patient assessment).
Design
A direct admission QI project team was formed that comprises five internal medicine residents, a patient safety officer from the institution, quality nurses and the associate programme director of the internal medicine residency. We employed the Plan-Do-Study-Act (PDSA) method of QI for this study. The study was conducted at Stony Brook University Hospital within the department of internal medicine residency programme from September 2014 to September 2015.
The data from the baseline measurement, in addition to discussion with stakeholders, revealed a number of significant areas with potential for improvement. We decided to limit our intervention to the department of medicine. This was mainly because we hoped to establish effectiveness of our interventions before expanding it to other departments where we would be less able to directly identify problems. The first concern we aimed to address was the variable, ill-defined direct admission process that lacks streamline communication of the direct admission process.
Strategy and improvement cycles
PDSA cycle 1
Aim for PDSA cycle 1: to create a flow diagram to improve communication in the direct admission process.
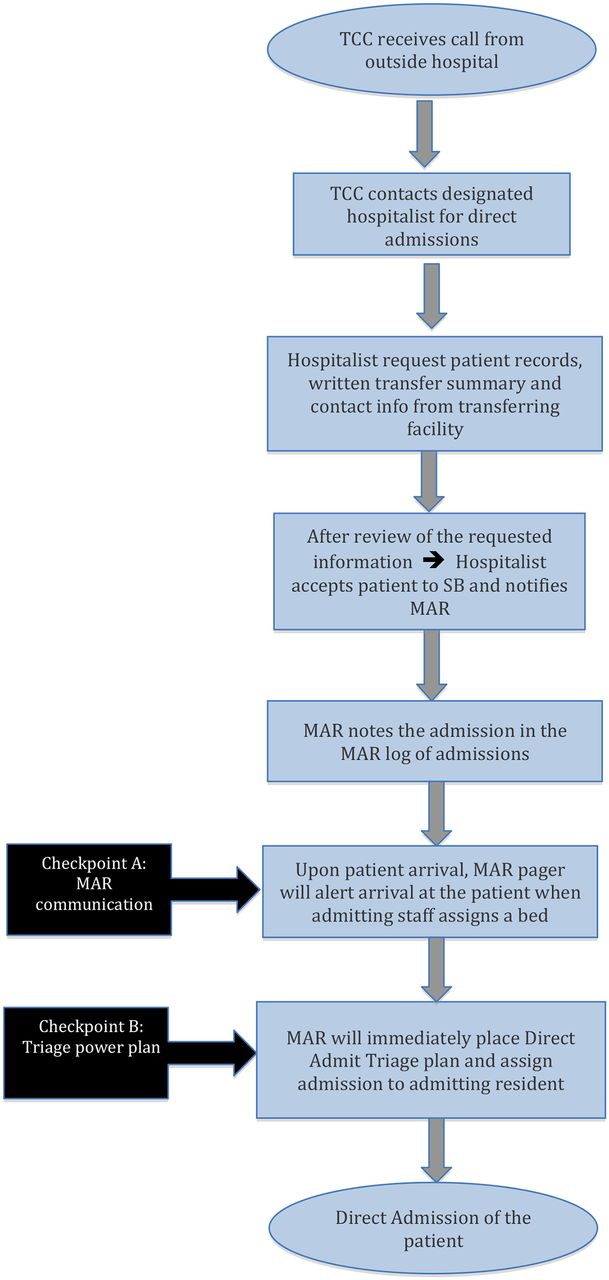
The first PDSA cycle focused on the lack of streamline communication from the decision to accept a direct admission to the physical arrival of the patient to our facility. We focused our attention on the overall ‘inefficient process of transfer’. This cycle involved meeting with the transfer call centre team, hospitalist team, patient safety officers and the chief medical officer of the hospital. Our intervention involved the creation of a written standardised, step-by-step flow diagram for the entire direct admission process (figure 2). We then educated the residents and hospitalists on how to use the structured flow diagram through weekly morning report didactics, website postings and email of a narrated instructional PowerPoint didactic we created.

Standardised flow diagram for direct admissions. MAR, medicine admitting resident; PDSA, Plan-Do-Study-Act; TCC, transfer call center; SB, Stony Brook Hospital.
PDSA cycle 2
Aim for PDSA cycle 2: revise the flow diagram to address critical communication point A: increase the number of direct admissions that are communicated to the MAR over a 2-month period.
The aim of the second cycle was to specifically address the issue of MAR communication. This cycle involved meeting with admitting staff and transfer call centre team to discuss the arrival phase of the direct admission process. We came to understand that the physician communication of acceptance of a patient could happen many days prior to the physical arrival of the patient to our facility. This was largely due to bed availability and the patient’s insurance approval of the transfer. At the time of patient arrival, the admitting personnel assign the patient to any available bed; this was often hours to days after the initial acceptance was made. During the interval time, the information from the accepting physician/transfer call centre team to the MAR was frequently lost in communication. This, unfortunately, led to the arrival of direct admission patients to the floors without real time communication to the accepting medical service. After meeting with the informatics team, this cycle successfully led to the development of a designated, real-time communication pager to alert the arrival of all direct admissions. The residency programme required the MAR to carry this device at all times and to notify immediately the resident or hospitalist in charge of the admission of the patient. This cycle also entailed education of the MARs during our daily morning report and the use of website postings of the purpose and guidelines related to the MAR pager. We revised the flow diagram to include MAR communication checkpoint A: MAR pager alert (figure 2, checkpoint A).
PDSA cycle 3
Aim for PDSA cycle 3: revise the flow diagram to address critical communication point B: decrease time delays in placement of orders and patient assessment.
The aim of PDSA cycle 3 was to specifically address the next culprit critical point in communication: resident delay in placement of admission orders (critical communication point B in figure 1). Although the residents were notified of the admission, there were prolonged unmonitored periods before physician orders were placed. There was a reliance on nursing to staff to identify and contact the appropriate care team for vital sign and lab test orders, leading to variable and often prolonged periods of unmonitored care in the hospital. Our residents were placing orders for vitals and labs when they physically arrived at the bedside to assess the patient; this was often hours after admission communication of assignment. This cycle involved meeting with the informatics team and patient safety officers to discuss a triage plan to avoid delays in order entry. This cycle subsequently led to the development of Direct Admit Triage Power Plan in our electronic medical record (EMR) system. The triage plan consists of prechecked immediate lab orders for initial patient assessment (table 1) placed by the MAR when the MAR pager alerts the arrival of the direct admission. We once again educated the residents and revised the algorithm to add an additional step to enter a triage power plan on patient arrival (figure 2, checkpoint B).
Direct admission triage power plan
After three PDSA cycles, the overall intervention involved a revised flow diagram that incorporated the use of two key communication tools: the MAR pager and the triage power plan in the EMR.
Results
We monitored data over time to assess two different process measures to monitor the success of the direct admission process: communication to the MAR and time delays associated with placement of admission orders. Postintervention, we conducted chart review of 15 direct admissions over a 2-month period. The first measure was the percentage of communication with the newly implemented MAR direct admits pager. Two months after intervention, we noted (15/15) 100% communication of all direct admits as verified with the MAR tracking log. Additionally, 100% (15/15) direct admissions contained contact information for the transferring facility and completed discharge summary for each patient.
The second measure assessed time delays associated with admission orders (including lab orders and vital sign order) placed for direct admissions. We measured interval time from patient arrival (time documented as arrival by EMS) to time of order placement (of vitals, labs or medication) by a physician or midlevel provider. In addition, we assessed the rates of unmonitored events, which we defined as abnormal lab findings, vital signs or rapid responses during this interval time period. Two months postintervention, we observed a sample of 15 direct admissions with the use of our newly implemented direct admission algorithm (revised end product with MAR pager communication and triage plan). The average unmonitored time interval decreased to an average of 53 min. The number of abnormal lab findings decreased to 6% (1/15) thus far (figure 3).

Results. MAR, medical admitting resident.
Lessons and limitations
There were a number of challenges that were identified during the implementation of the entire direct admission process. We needed repeat didactics and website postings to educate and create awareness of the intervention to the residents. Dissemination of the intervention was challenging as we relied on morning report announcements, narrated PowerPoint didactics and website postings. We found that repeated education of the purpose behind the intervention and showing impact of change were very useful strategies to target resident trainees. Buy-in was attained from hospitalists, informatics staff and patient safety officers by voicing safety concerns, presenting pertinent data and starting the initiative slowly with the standardised flow diagram, MAR pager device and gradually ramping up to the EMR triage plan.
One of the limitations of this study is our small postintervention sample size of patients. The number of direct admissions we receive at our institution can vary from 2 to 10 patients per month. We monitored a 2-month postintervention period, consistent with all of our postintervention time frame. During those 2 months, we only received 15 direct admit patients to the general medicine service. We continue to find it challenging for residents to remember to use the direct admit triage power plan. Future directions include continued education and reminders of the EMR triage power plan use for all direct admissions.
Another limitation of this study is the generalisability of the direct admission intervention and its impact on patient care. We assessed resident observation of the unmonitored events through chart review; we did not assess actual adverse events or patient harm. Our aim was to focus on process measures related to the direct admit process in the residency programme. We did not assess outcome measures related to direct patient care. This study was a small-scale departmental study, which is another limitation. The focus was on a resident-driven initiative to create process improvement. We did not intervene on departments other than general internal medicine. Next steps include dissemination and integration with other departments and to expand the direct admit protocol into an institution-wide model. We plan to further assess the compliance and effectiveness of the entire flow diagram and its applicability to other departments. The end result of the flow diagram use has led to the presence of contact information as well as discharge summary from the transferring facility. We did not intend to measure this and hence did not obtain preintervention data on this. This was a coincidental positive outcome of the study. We based our results on chart-reported data; we monitored the chart for order placement and MAR tracking log for written documentation of communication. We presumed that these results reflect communication and patient assessment but we did not physically check to ensure that the data were accurate. Given the resources we had, this was the most feasible way to measure our outcomes.
We learnt that implementation of a standardised flow diagram is beneficial but may not be sufficient in addressing communication breakdown points. A flow diagram often needs to be dissected, and each part needs to be thoroughly analysed to create effective interventions in processes of care. The biggest strength of this project is the demonstration of a resident-driven initiative to create change. Residents are front-line providers and can play a crucial role in creating system-wide changes on an institutional level.
Conclusions
Our QI project demonstrates a resident-driven approach to address gaps in communication in the direct admission process. Our intervention entailed the use of a standardised structural change in the direct admission process. We were able to delineate a clear step-by-step process that improved awareness and communication in the overall care of patients that are directly admitted to the hospital. A structured and standardised approach to communication during transition of care is crucial to patient safety. Our QI project elucidates an ill-defined process with a robust flow diagram that specifically incorporates EMR integration of a triage plan and real-time communication of patient arrival. We believe that our process of developing a direct admission system by using QI methodology can be duplicated at other hospitals and can thereby improve a portion of a hospital’s patient flow and communication.
Acknowledgments
The authors would like to thank the residents of the Stony Brook University Internal Medicine residency programme, with special mention to members of the Patient Safety Quality Council namely Drs Matthew Joseph, Konstantin Peysin, Christine Garcia, Anu Neerukonda, Don Nguyen and Rishi Mehta. The authors would also like to thank Dr Joseph Decristafaro, Dr Riyaz Kamadoli and Mei Cobb, AD IT.
Footnotes
Contributors NG was responsible for the overall content of the manuscript, conducted the conceptual design of the QI project, drafted the original version of the manuscript, edited and revised the manuscript, did the final approval of the manuscript and edited and submitted the IRB QI proposal. LH conducted several critical revisions of the article, carried out the planning of PDSA cycles, created figures 1 and 2, wrote the original IRB QI proposal, created the narrated QI didactics and conducted educational didactic sessions on the intervention. LO was responsible for data analysis and tracking, was responsible for data collection, conducted several critical revisions of the article, created table 1, created figure 3 results and conducted educational didactic sessions on the intervention.
Competing interests None declared.
Ethics approval The Institutional Review Board at Stony Brook University Hospital, NY, deemed this study as exempt as an educational initiative. IRB acknowledgement #717726-1.
Provenance and peer review Not commissioned; internally peer reviewed.