Article Text

Abstract
Background School closures due to the coronavirus disease 2019 (COVID-19) pandemic are harmful to children’s education. Uncertainty in infectiousness and challenges of managing asymptomatic infection slowed school re-opening in many areas of the US. The pandemic required fast, evolving, iterative response from public health and K-12 schools.
Objective Use data displays designed for improvement, coupled with expertise in learning from variation, to offer insights in a fast-paced policy environment. Provide learning support alongside data.
Methods A multidisciplinary team with expertise in epidemiology, family medicine, public health, and biostatistics formed to provide support in learning methods to the second largest US K-12 school system. The team generated time series and funnel statistical process control charts, using the drill-down pathway to provide insight at multiple levels of the school system. The team identified essential capabilities in data and scientific translation to support real-time, fast-paced operational decision-making.
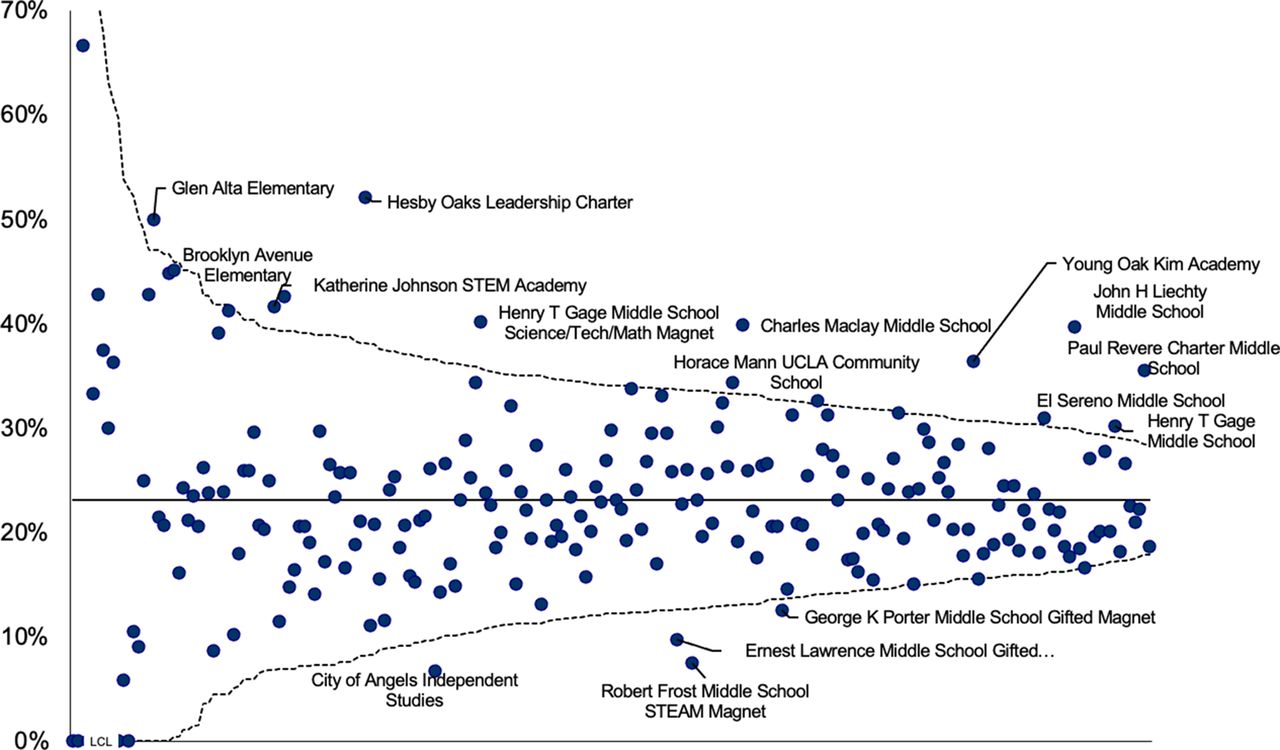
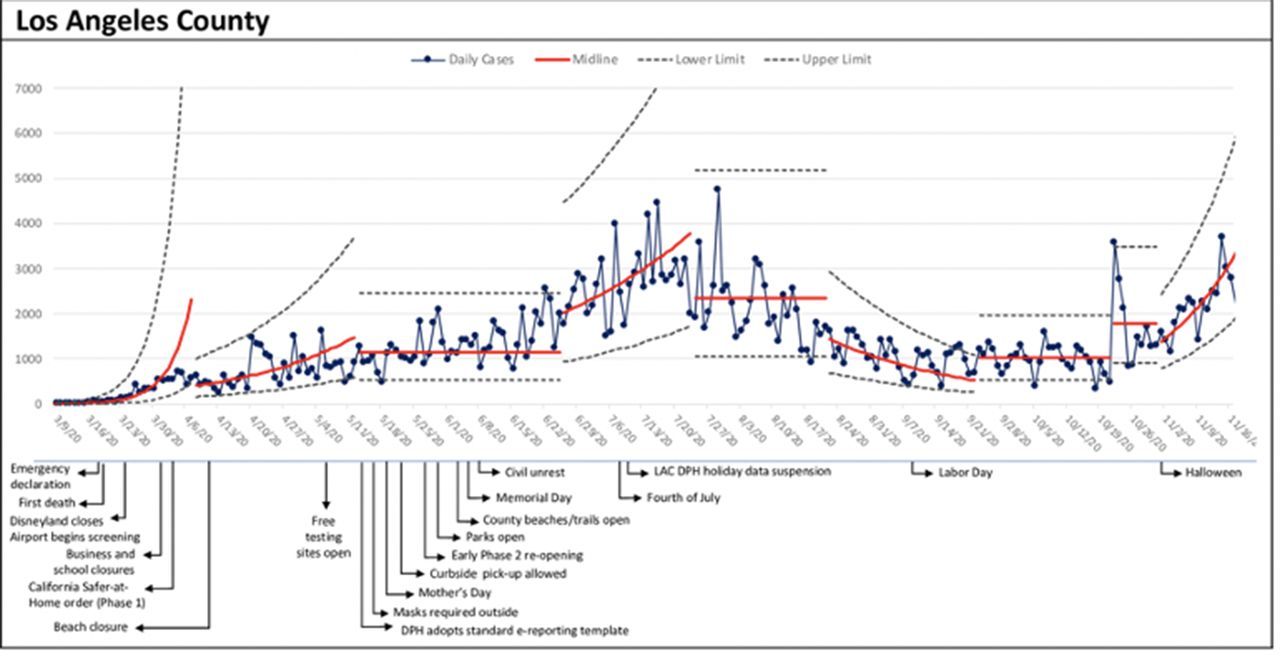
Results Outcomes include positive COVID-19 tests identified through surveillance (figure 5), school-based secondary infection, school enrollment (figures 1 and 2), quarantine associated with being a close contact of a COVID-19 positive student or staff member, and vaccination drawing from community-level data linked with school region (figures 3 and 4). Data displays showed variation in actionable formats.
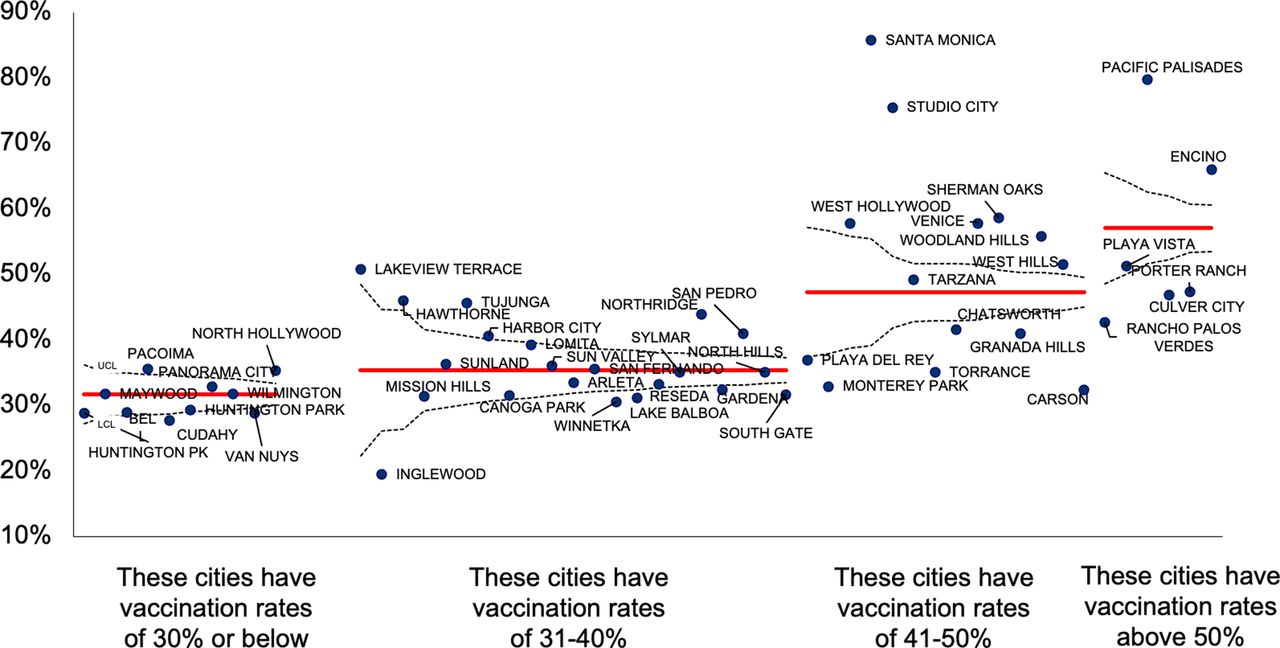
P Chart (funnel chart):% of Los Angeles Unified elementary students electing in-person learning by city within the school district catchment area when schools re-opened, stratified by community vaccination rate

P Chart:% of Grade 6–8 students electing in-person learning in 215 middle schools

C Chart and cumulative percentage: Uptake of vaccine by age group & neighborhood

C Chart (annotated) # of residents age 16–17 receiving their first COVID-19 vaccine dose, in selected neighborhoods

Hybrid C Chart and I Chart: COVID-19 case counts
Conclusions Common data displays in COVID-19 lack elements required to learn from variation, including denominators, disaggregation (granularity), and operationally relevant stratification (such as subregion and school configuration). Providing these displays offered actionable data to the school district that they employed in areas such as vaccination outreach and testing protocols. There is an ongoing need for scientific input and support of actionable data displays, for use by public health as well as school districts. Future work will include incorporating these displays into operations and generating them from developing databases.